For three years I haven't used the mains water and now when I want it, given this extended warmth and lack of rain, it isn't available.
First is to calculate the amount of water wanted: 3Lt per day for food and drinking.
Next water for washing, self and clothes
Thirdly for watering plants
Although this has become critical this July there are other times in the year when I have little stored
2026: Mains Supply
July 19th Went with Gavin to meet Mark to talk over the break. Mark said he will replace the leaking joint with a tap at my suggestion and surround the fix with a box. etc. All really helpful.
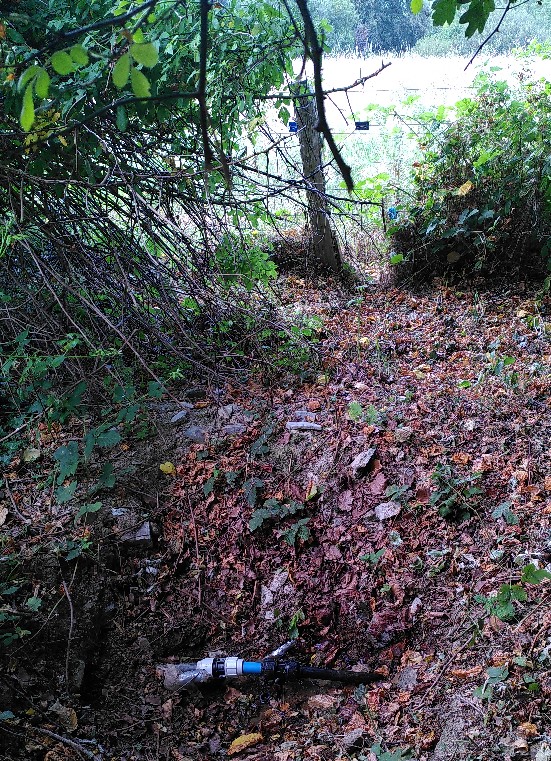
July 18th 17:43 | 101.3118 Went to check leak. �Turned off. See Mark tomorrow and consider how to check the fix won't leak, cover with a protective 'bucket'. Maybe use a tap � Location of Leak and Repair
July 18th 13:20 | 97.629 Ok water flowing ✅
July 18th 11:16 Mark from the Coach House just sent me a message saying he had accidentally cut through the pipe and is in the process of repairing it, so will go and turn on again to see if it is flowing to the land.
July 17th On my way 'home' Mark drove by and stopped to say hello and asked . . . I said it was coincidentally as I was thinking about asking him if anyone had recently worked on the area as I knew work was being done to install another supply.
July 17th 18:55 Fully open so water flowing somewhere. Seems there must be a serious break in the pipe that won't 'allow' any to flow between the parts, so a big break and more. ✘ Forgot to take final reading . . . . .
July 17th 18:06 94.410 No output at all, but meter showing flow. � Leak � Broken pipe likely.
July 17th 17:08 Very low pressure and not outputting, so going to open mains further.
July 17th 16:00 93.2704� Backed up a bit.
July 15th Wondering if I will use it ?
23
June 14th From 90.9244 to 93.2718
June 5th From 89.9503 to 90.9242
May 29th From 88.8052 to 89.9???
2022
August 14th From 87.7075 to 88.8052
August 9th From 86.0943 to 87.7072
July 18th From 85.0435 to 86.0939
May 12th From 84.6019 to 85.0429 First use this year. Only 30Lt diff from last record (red)
2021
Jun 22nd From 83.8998 to 84.5702. Dry summer but rained a little yesterday so thought I'd ensure it wasn't just a surface soaking
Apr 24th From 83.**** to 83.8998. Gavin turned on water late afternoon
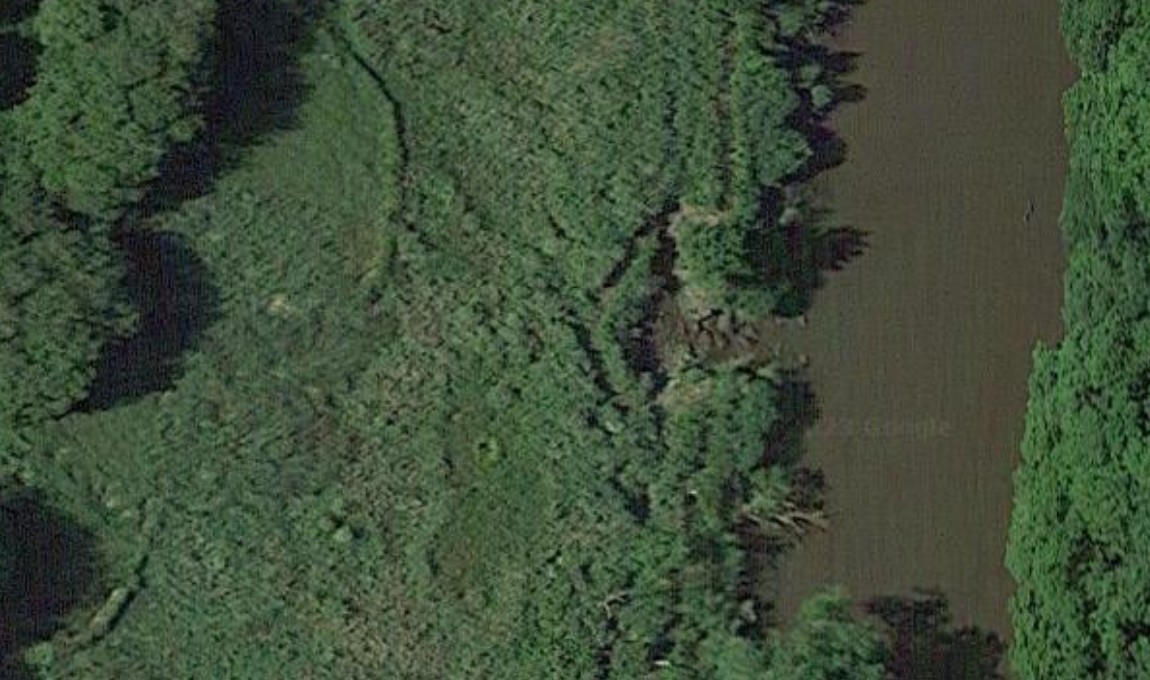
Apr 21st From 82.5912 to 83.3959. Water was used to wash down the wagon after work on the exterior. Note the raised strip across the track and the black pipe to the left.There is now a permanent water pipe to the bottom of the triangle field. The plastic pipe runs through a heavy duty steel conduit some inch or two below the track.
Date Missing?? From 81.5164 to 82.5912. First use this year. Only 100ml diff from last record (orange)
2020
June 1st From 76.3680 to 81.5163 Leaving tap on over night.
May 27th From 74.6461 to 76.3679 Left tap on all day.
May 25th From 73.0190 to 74.6460
May 19th From 71.1373 to 73.0189. Continuing dry spell since March
May 11th From 70.1539 to 71.1372. First use this year. Only 10Lt diff from last record (yellow)
Here is a photo of the location of the meter, forth from the left, although there is another either side of the four shown but they are often not visible being closer to the traffic disturbance.
2019
May 20th From 62.5671 to 63.8371. First use this year. Only 20Lt diff from last record (yellow)
June 28/29th From 63.8376 to 65.7269. Left tap on for 24hrs. and although 2m3 have been used I doubt I used even 1m3
July 9th From 65.7263 to 67.5281
July 25th From 67.5281 to 70.1538
2018
July 17th From 59.4388 to 61.3838 :: July 21st From 61.3842 to 62.5669
June 23rd From 57.2506 to 59.4984
May 16th From 54.387.81 to 56.487.92 :: May 23rd From 56.487.92 to 57.2499
First use this year. Little rain over the last month, although a sprinkling today, and none foreseen for the next week. Turned supply on around 8am. Watered, immediately, filled containers and watered again late afternoon. Will leave on overnight, despite the leakage and water again in the morning.
From 54.387,81 to 56.487,92 is 2.10011 m3 used though I expect half of that is leakage. Trying to edit a video and from that see the amount of water used over 1 minute for example.
May 21st Found beaver downed tree west of the willow carr on the bund. Don't know when
2023
April16th Found beaver downed tree.
2019
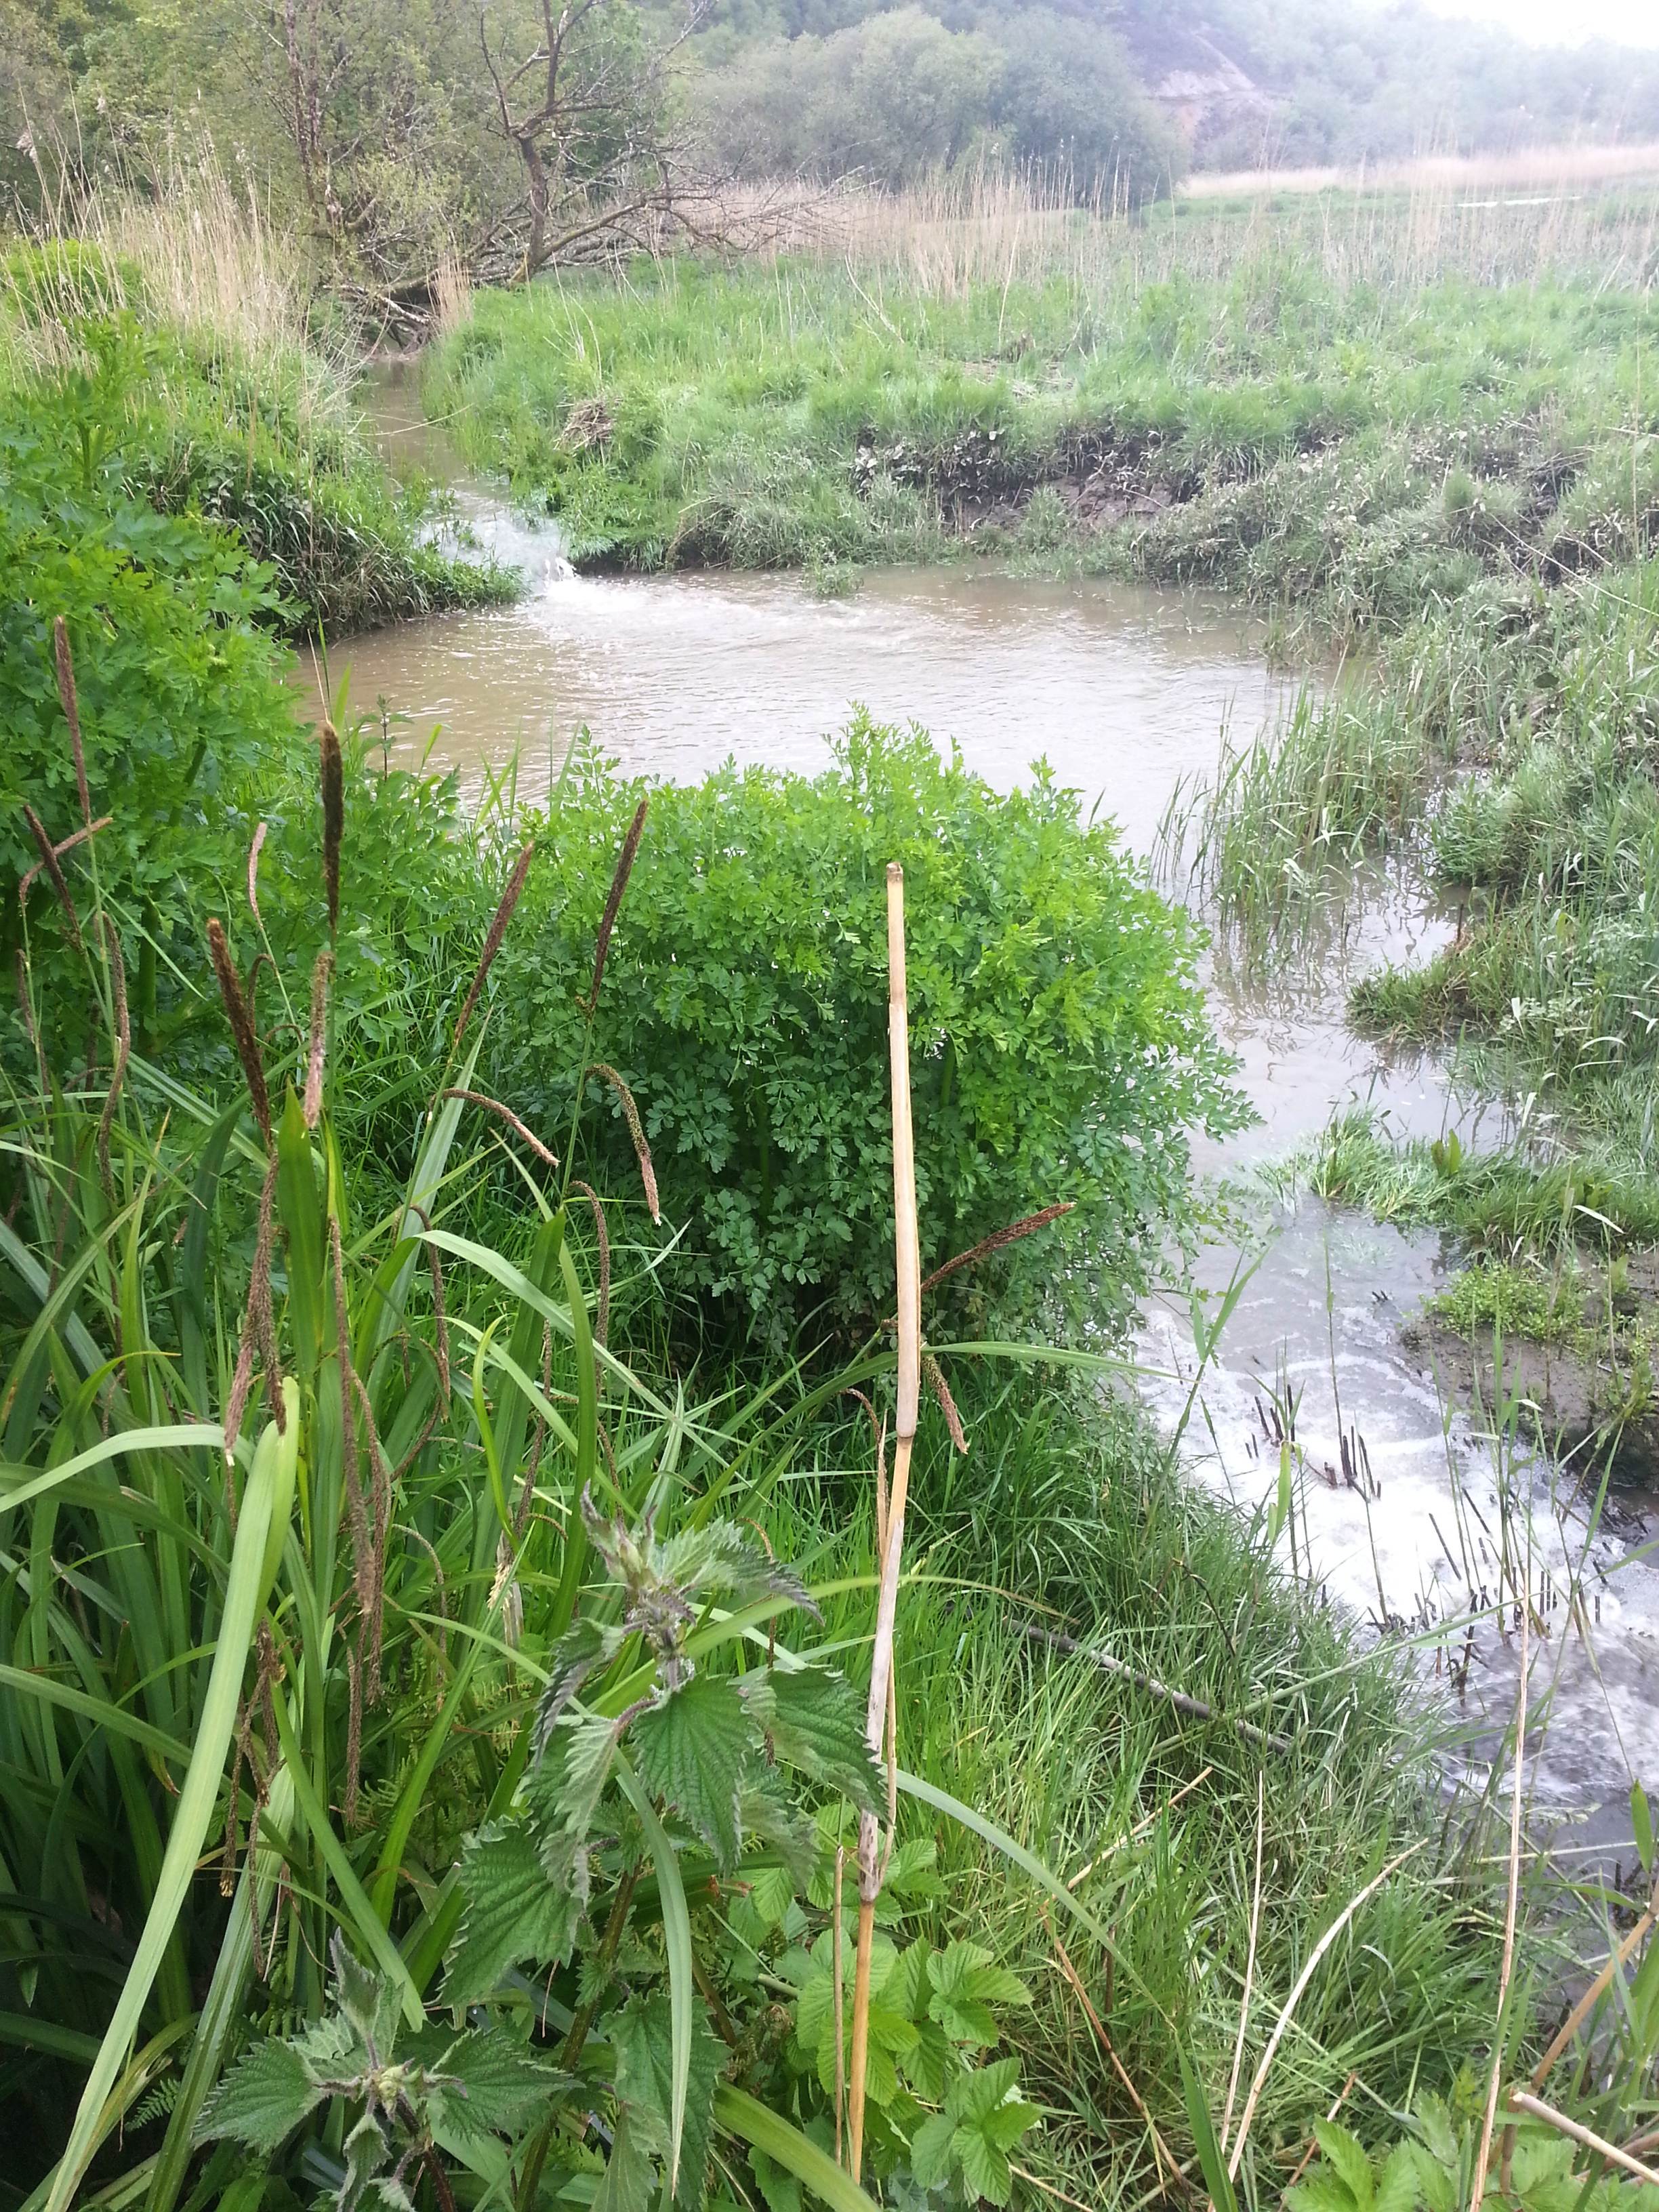
Well not much bova and no sight of a beaver. But I noticed some chippings off a willow tree by the river and looking at the teeth marks, thought it could only be a beaver.
March 26th: Top viewApril 11th
Hugh Tyler from Natural England and my Friend Rowena have informed me that a beaver was caught in Gunnislake around Christmas 2008. Rowena said the beaver may have been from a transition site in north Devon, acclimatising before transfer to Scotland. Maybe another escapee or the same one. Poor soul is alone and trying to dam the River Tamar on a tidal stretch.